Free Access
Fig. 4
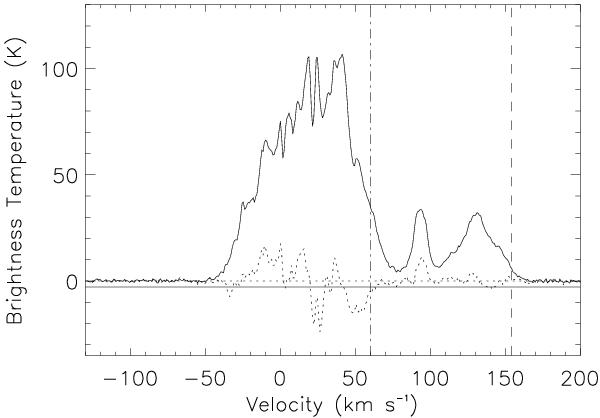
HI emission spectrum (solid curve), together with the absorption profile (dotted curve) for the SNR G15.4+0.1. The tangent point velocity is indicated by the dashed vertical line, while the maximum velocity absorption feature is marked by the dot-dashed vertical line.
Current usage metrics show cumulative count of Article Views (full-text article views including HTML views, PDF and ePub downloads, according to the available data) and Abstracts Views on Vision4Press platform.
Data correspond to usage on the plateform after 2015. The current usage metrics is available 48-96 hours after online publication and is updated daily on week days.
Initial download of the metrics may take a while.