Free Access
Fig. 3
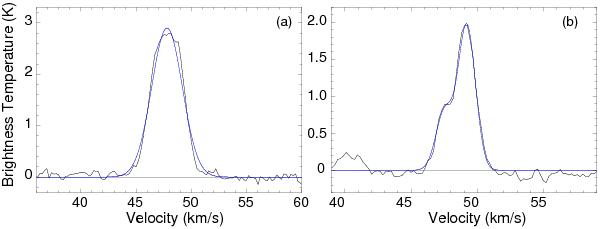
Averaged 13CO (J = 1–0) spectra obtained toward a) clump A and b) clump B, in the northernmost and central regions of the SNR G15.4+0.1. The Gaussian fit to each spectrum is shown by the blue curves.
Current usage metrics show cumulative count of Article Views (full-text article views including HTML views, PDF and ePub downloads, according to the available data) and Abstracts Views on Vision4Press platform.
Data correspond to usage on the plateform after 2015. The current usage metrics is available 48-96 hours after online publication and is updated daily on week days.
Initial download of the metrics may take a while.