Fig. 2
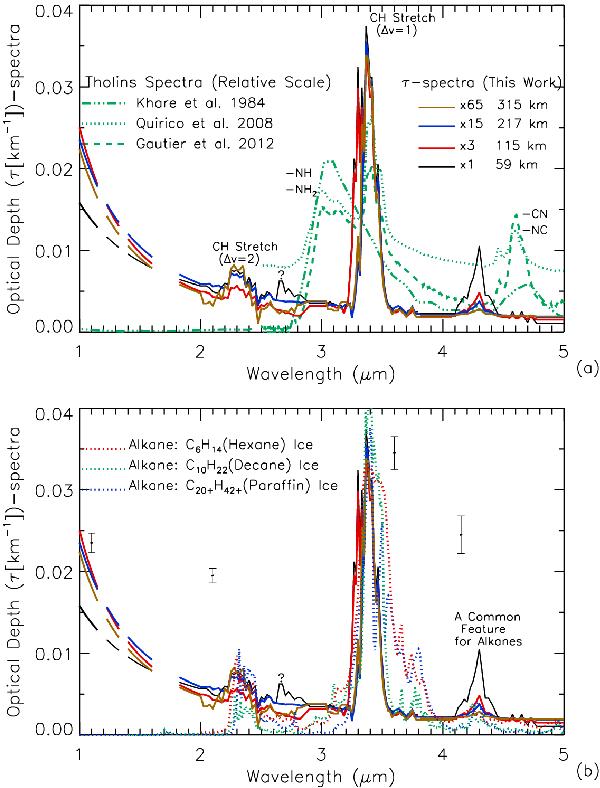
Comparison between the derived haze τ-spectra (at the selected altitudes of 59, 115, 217, and 315 km) and the spectra of a) tholins and b) alkane ices. Between 1 and 2 μm, we discarded the wavelength intervals (shown as dashed lines in Fig. 1a) in which the τ-spectra are most uncertain. a) The tholin spectra are adopted from the literature (Khare et al. 1984; Quirico et al. 2008; Gautier et al. 2012). b) Spectra measured (Clark et al. 2009) for the alkane powders C6H14 (hexane), C10H22 (decane), and C20+H42+ (paraffin) provide a satisfactory fit to the three major peaks of the haze τ-spectra at 2.3, 3.4, and 4.3 μm. The ± 1σ error bars for the 1−1.6, 1.8−3, 3−3.9, and 3.9−4.8 μm intervals of the τ-spectra are shown.
Current usage metrics show cumulative count of Article Views (full-text article views including HTML views, PDF and ePub downloads, according to the available data) and Abstracts Views on Vision4Press platform.
Data correspond to usage on the plateform after 2015. The current usage metrics is available 48-96 hours after online publication and is updated daily on week days.
Initial download of the metrics may take a while.