Fig. 1
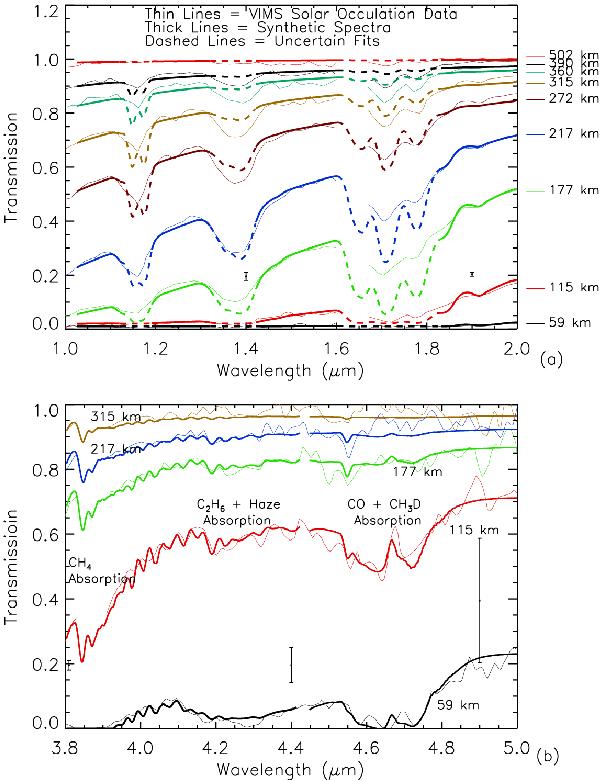
Comparison between synthetic spectra and the VIMS spectra. a) In the 1−2 μm range for the selected altitudes of 59, 115, 177, 217, and 315 km. Wavelength intervals in which the model fits are not satisfactory are shown by dashed lines; they correspond to the centers of the Δν = 3, 4, and 5 bands of CH4 near 1.7, 1.4, and 1.2 μm. b) In the 3.8−5 μm range at the selected altitudes of 59, 115, 177, 217, and 315 km. The synthetic spectra include the influence of CH4, CH3D, C2H6, CO2, CO, and haze absorption and scattering. The ± 2σ error bars for the 1−1.6, 1.8−2, 3.8−4.8, and 4.8−5 μm intervals of the VIMS spectra are adopted from Bellucci et al. (2009).
Current usage metrics show cumulative count of Article Views (full-text article views including HTML views, PDF and ePub downloads, according to the available data) and Abstracts Views on Vision4Press platform.
Data correspond to usage on the plateform after 2015. The current usage metrics is available 48-96 hours after online publication and is updated daily on week days.
Initial download of the metrics may take a while.