Fig. 3
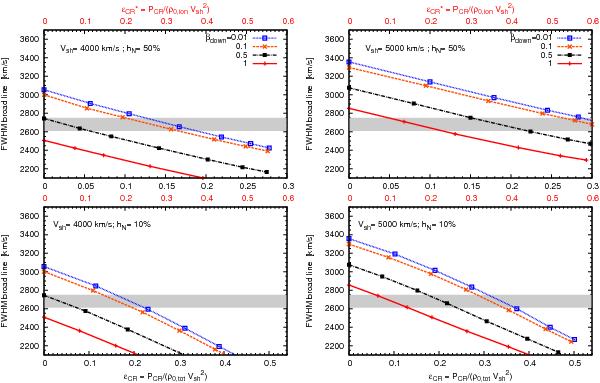
FWHM of the broad Balmer line as a function of the CR acceleration efficiency. Different lines show different electron-ion equilibrium levels. The plots on the left (right) are obtained for Vsh = 4000 km s-1 (Vsh = 5000 km s-1). The top (bottom) panels refer to neutral fraction hN = 50% (hN = 10%). The total gas density is n0 = 0.6 cm-3 (Badenes et al. 2008). The shaded area shows the FWHM as measured for the SW shock by Helder et al. (2010) at 1σ level.
Current usage metrics show cumulative count of Article Views (full-text article views including HTML views, PDF and ePub downloads, according to the available data) and Abstracts Views on Vision4Press platform.
Data correspond to usage on the plateform after 2015. The current usage metrics is available 48-96 hours after online publication and is updated daily on week days.
Initial download of the metrics may take a while.