Fig. 6
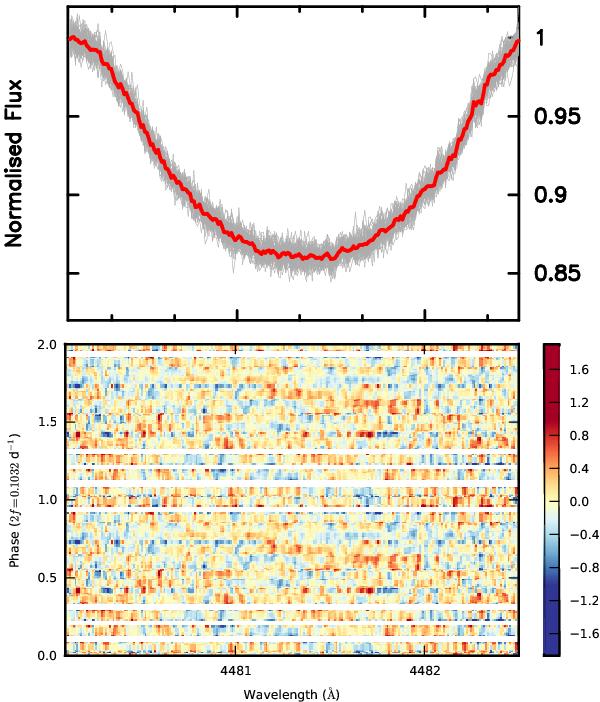
Top: time series of the Mg ii line at 4481 Å distilled from the HARPS spectra, with a time base of 25.2 d. The red thick line is the average Mg ii line. The bottom panel shows the residual Mg ii line profiles with respect to the average line profile as a function of the rotational phase and represented in a colour scale, where we applied a sliding boxcar smoothing with a bin width of 0.05 Å and a step size of 0.005 cycles; for better visibility we show two cycles.
Current usage metrics show cumulative count of Article Views (full-text article views including HTML views, PDF and ePub downloads, according to the available data) and Abstracts Views on Vision4Press platform.
Data correspond to usage on the plateform after 2015. The current usage metrics is available 48-96 hours after online publication and is updated daily on week days.
Initial download of the metrics may take a while.