Fig. 9
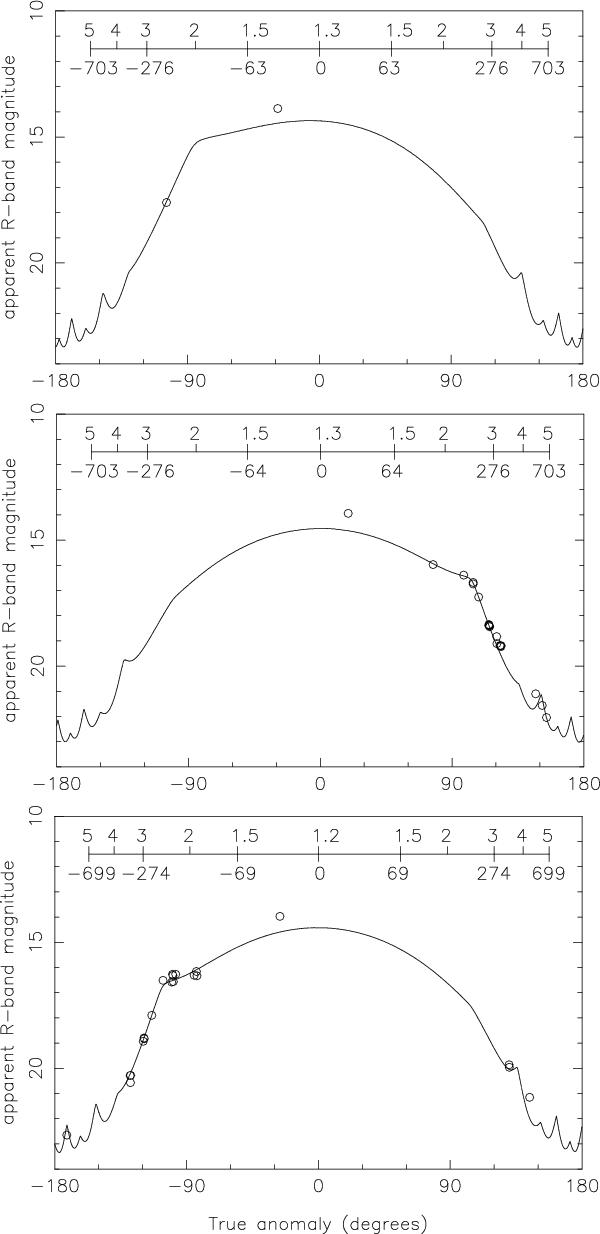
Model fit to the archival photometry, plotted against true anomaly in degrees. Here the photometry is plotted as apparent magnitudes within ρ = 5″ (without correction for observing geometry), as the model includes the geometry (producing “waves” near aphelion due to changing geocentric distance). The three perihelion passages (1996, 2002 and 2009) are plotted separately. The scale across the top of each figure gives the corresponding heliocentric distance (AU) and ΔT (days). The model reproduces all data well except for that within ~ 30° (≈ ±1 month) of perihelion, where there is enhanced activity.
Current usage metrics show cumulative count of Article Views (full-text article views including HTML views, PDF and ePub downloads, according to the available data) and Abstracts Views on Vision4Press platform.
Data correspond to usage on the plateform after 2015. The current usage metrics is available 48-96 hours after online publication and is updated daily on week days.
Initial download of the metrics may take a while.