Fig. 6
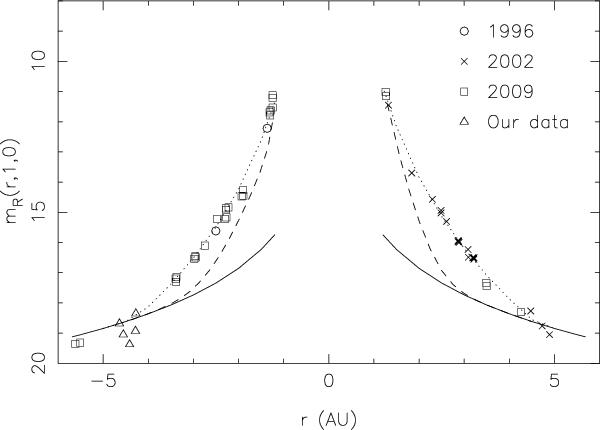
Heliocentric lightcurve, showing the R-band magnitude measured within an aperture of radius 10 000 km at the distance of the comet, corrected to unit geocentric distance and zero phase angle, against heliocentric distance in AU. Negative heliocentric distance shows pre-perihelion measurements. Different symbols show data taken during different apparitions, and highlight “our data” presented in Sect. 3 (which were taken at the start of the 2009 apparition). The solid black line shows the expected magnitude of the bare nucleus, based on the absolute magnitude reported by Tubiana et al. (2011). The dashed line shows a prediction for the total magnitude based on a water production rate model (see Sect. 4.3), while the dotted lines show a power law fit to the data.
Current usage metrics show cumulative count of Article Views (full-text article views including HTML views, PDF and ePub downloads, according to the available data) and Abstracts Views on Vision4Press platform.
Data correspond to usage on the plateform after 2015. The current usage metrics is available 48-96 hours after online publication and is updated daily on week days.
Initial download of the metrics may take a while.