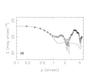
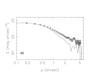
Fig. 5
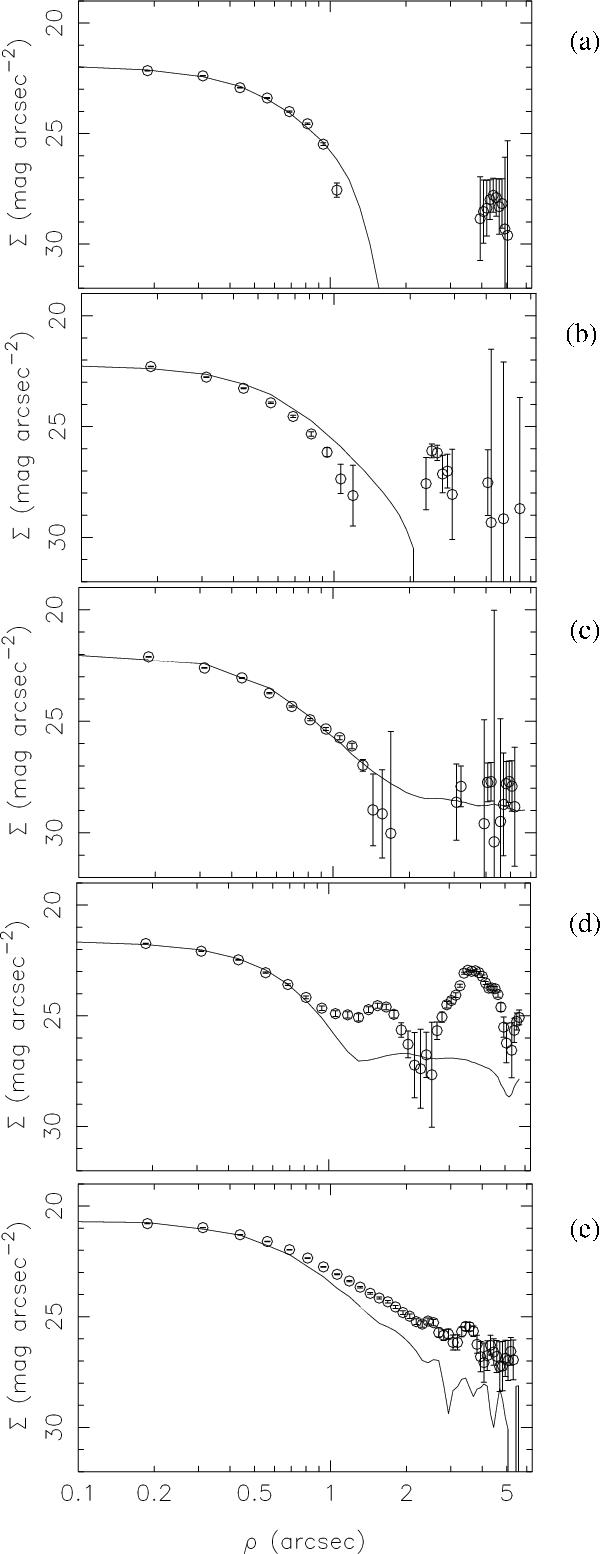
Surface brightness profiles for the comet in a) August; b) September; c) October; d) November 2007; and e) March 2008. The points show the comet profile, while the line shows the image PSF. a)–c) show star-like profiles, while e) shows clear activity. d) is difficult to interpret due to residuals in the image from saturated stars (the bumps beyond ρ = 1″). The gaps in the comet profiles in a)–c) around ρ ~ 2″ are due to the negative imprint from the reference image.
Current usage metrics show cumulative count of Article Views (full-text article views including HTML views, PDF and ePub downloads, according to the available data) and Abstracts Views on Vision4Press platform.
Data correspond to usage on the plateform after 2015. The current usage metrics is available 48-96 hours after online publication and is updated daily on week days.
Initial download of the metrics may take a while.