Fig. 3
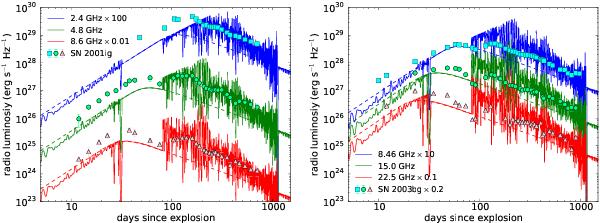
Comparisons between the model radio LCs from the 20 M⊙ model and the observed radio LCs of SNe IIb 2001ig (Ryder et al. 2004) and 2003bg (Soderberg et al. 2006). The frequencies of the observed radio LCs are 2.4 GHz (square), 4.8 GHz (circle), and 8.6 GHz (triangle) in the left panel. The LCs of 2.4 GHz and 8.6 GHz are multiplied by 100 and 0.01, respectively, for illustrative purpose. In the right panel, the frequencies of the observed radio LCs are 8.46 GHz (square), 15.0 GHz (circle), and 22.5 GHz (triangle). The LCs of 8.46 GHz and 22.5 GHz are multiplied by 10 and 0.1, respectively. The radio LCs of SN 2003bg are multiplied by 0.2 as well to match the synthesized LCs.
Current usage metrics show cumulative count of Article Views (full-text article views including HTML views, PDF and ePub downloads, according to the available data) and Abstracts Views on Vision4Press platform.
Data correspond to usage on the plateform after 2015. The current usage metrics is available 48-96 hours after online publication and is updated daily on week days.
Initial download of the metrics may take a while.