Fig. 1
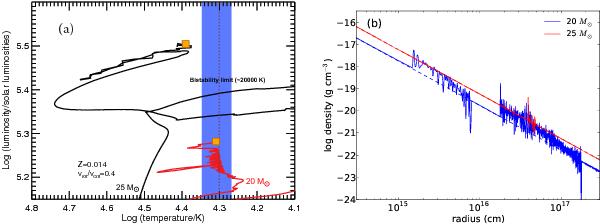
a) End part of the evolutionary tracks in the HR diagram for the 20 and 25 M⊙ rotating models. The end point is shown as an orange square. The bistability limit, where jumps in Ṁ and v∞ occur, is indicated in blue. The vertical line corresponds to the bistability limit computed for the end point according to the Vink et al. (1999) recipe. b) CSM density structures obtained from the evolutionary models (solid lines). The CSM densities with dashed lines are the CSM without the mass-loss variations and used to obtain the reference LCs.
Current usage metrics show cumulative count of Article Views (full-text article views including HTML views, PDF and ePub downloads, according to the available data) and Abstracts Views on Vision4Press platform.
Data correspond to usage on the plateform after 2015. The current usage metrics is available 48-96 hours after online publication and is updated daily on week days.
Initial download of the metrics may take a while.