Fig. 6
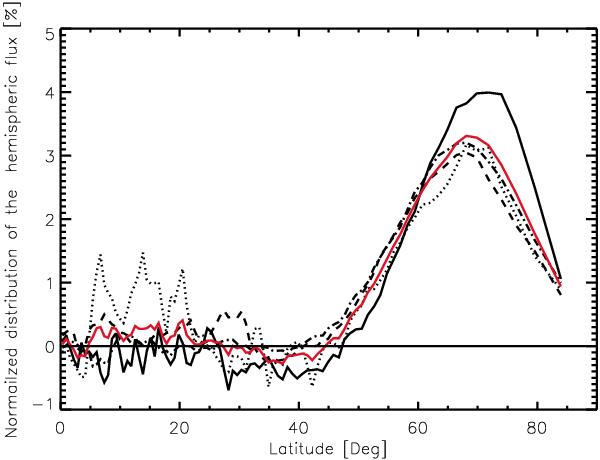
Normalized distribution of the net flux in each hemisphere per degree as a function of latitude for the minimum between cycles 23 to 24 (solid black), cycle 22 to 23 (dash–dot), 21 to 22 (dashed) and 20 to 21 (dotted). In each case the fluxes have been averaged over 2 years centered on the minimum. The red curve shows the average over all the cycles.
Current usage metrics show cumulative count of Article Views (full-text article views including HTML views, PDF and ePub downloads, according to the available data) and Abstracts Views on Vision4Press platform.
Data correspond to usage on the plateform after 2015. The current usage metrics is available 48-96 hours after online publication and is updated daily on week days.
Initial download of the metrics may take a while.