Fig. 4
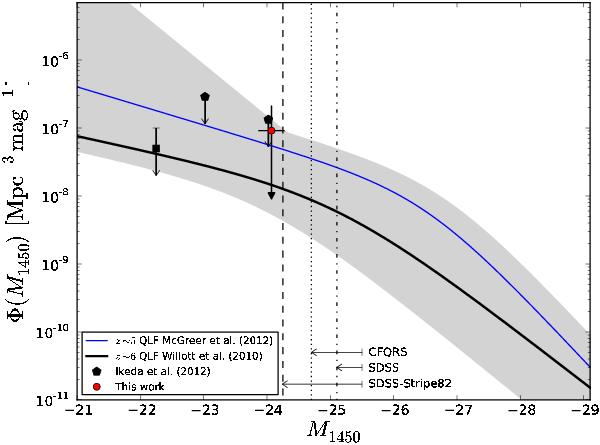
QSO space density distribution as a function of the rest-frame 1450 Å monochromatic magnitude. The corresponding space density of ALH023002+004647 is represented by the red dot. For comparison with some recent determinations of the high-z QLF, we have plotted the ⟨ z ⟩ ~ 5 SDSS-Stripe82 QLF derived by McGreer et al. (2013, blue line) and the ⟨ z ⟩ ~ 6 CFQRS+SDSS-Deep QLF derived by Willott et al. (2010b, black line). The vertical lines indicate the faintest magnitude bin sampled by the SDSS-Main, SDSS-Stripe82, and CFQRS. The grey shaded area delimits the range covered by the published QLFs in the redshift bin [5−6] (see text for details). The black pentagons represent the upper limits derived by Ikeda et al. (2012) in the COSMOS field while the black square shows the space density associated to the faintest known QSO above z = 5 (Willott et al. 2010b).
Current usage metrics show cumulative count of Article Views (full-text article views including HTML views, PDF and ePub downloads, according to the available data) and Abstracts Views on Vision4Press platform.
Data correspond to usage on the plateform after 2015. The current usage metrics is available 48-96 hours after online publication and is updated daily on week days.
Initial download of the metrics may take a while.