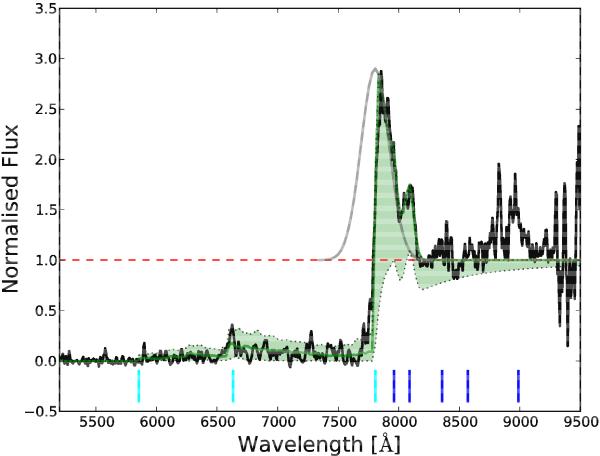
Fig. 2

Modellisation of the observed spectrum divided by the fitted continuum (black line). The Lyα, N V, and Si II λ1260 lines have been modelled with Gaussian profiles. The Gaussian fit to Lyα is shown in grey. The result of dividing the normalised continuum plus the modelled lines by the median absorption, as well as upper and lower 2-σ deviations, generated by simulating 100 IGM sightlines at the same redshift are shown as a continuous (median) and dotted green line (2-σ limits). Vertical cyan lines mark the positions of the Lyman limit, Lyβ, and Lyα lines at the reference redshift. Blue vertical lines mark the expected positions of the N V λ1240, Si II λ1260, O I λ1302, C II λ1335, and (O IV+Si IV)λ1400 emission lines at the same redshift.
Current usage metrics show cumulative count of Article Views (full-text article views including HTML views, PDF and ePub downloads, according to the available data) and Abstracts Views on Vision4Press platform.
Data correspond to usage on the plateform after 2015. The current usage metrics is available 48-96 hours after online publication and is updated daily on week days.
Initial download of the metrics may take a while.


