Fig. 1
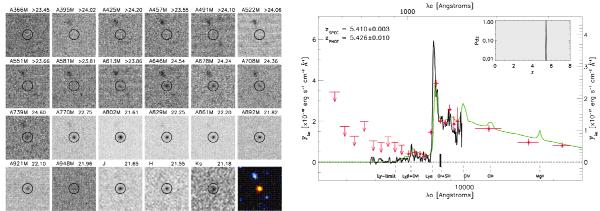
Left: cutouts (15′′ × 15′′) in all the ALHAMBRA optical/NIR filters for the discovered QSO (highlighted by an open circle). Above each cutout we indicate the filter name and measured magnitude (or 5-σ lower limit). The final image is a colour composite of all bands, where the contrast has been increased to make all objects clearly visible. Images are oriented with north up and east to the left. Right: optical-NIR spectral energy distribution of the discovered QSO. ALHAMBRA photometric detections are represented as circles with associated error bars (arrows indicate the 5σ upper limits). The reference magnitude in the m830 filter is indicated by a vertical thick line. The best photo-z template solution (QSO with optical slope index α = −0.25 at zPHOT = 5.426 ± 0.010) is shown as a green line, while the OSIRIS/GTC spectrum (smoothed with a 7 pixel box) is shown as a thick black line, with the redshift probability function (Pdz) in the inset. The agreement found between the spectro-z and the photo-z is remarkable. The most important emission lines for QSOs at the redshift of the source are also indicated.
Current usage metrics show cumulative count of Article Views (full-text article views including HTML views, PDF and ePub downloads, according to the available data) and Abstracts Views on Vision4Press platform.
Data correspond to usage on the plateform after 2015. The current usage metrics is available 48-96 hours after online publication and is updated daily on week days.
Initial download of the metrics may take a while.