Fig. 23
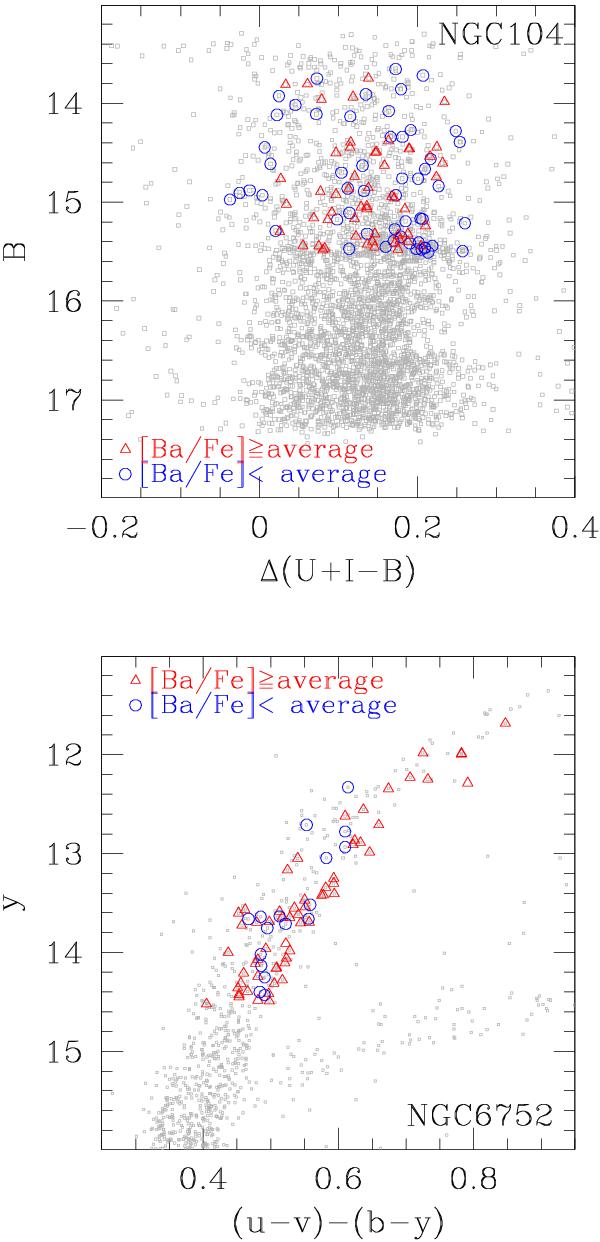
Plot for 47 Tuc (top), using the same filter combination adopted in Milone et al. (2012) to show a split RGB (see their Figs. 21 and 26). The photometry is not the same. Ba-rich and Ba-poor stars are not segregated. For NGC 6752 (bottom), we show the same effect on a plot similar to the one in Milone et al. (2013; their Fig. 15).
Current usage metrics show cumulative count of Article Views (full-text article views including HTML views, PDF and ePub downloads, according to the available data) and Abstracts Views on Vision4Press platform.
Data correspond to usage on the plateform after 2015. The current usage metrics is available 48-96 hours after online publication and is updated daily on week days.
Initial download of the metrics may take a while.