Fig. 3
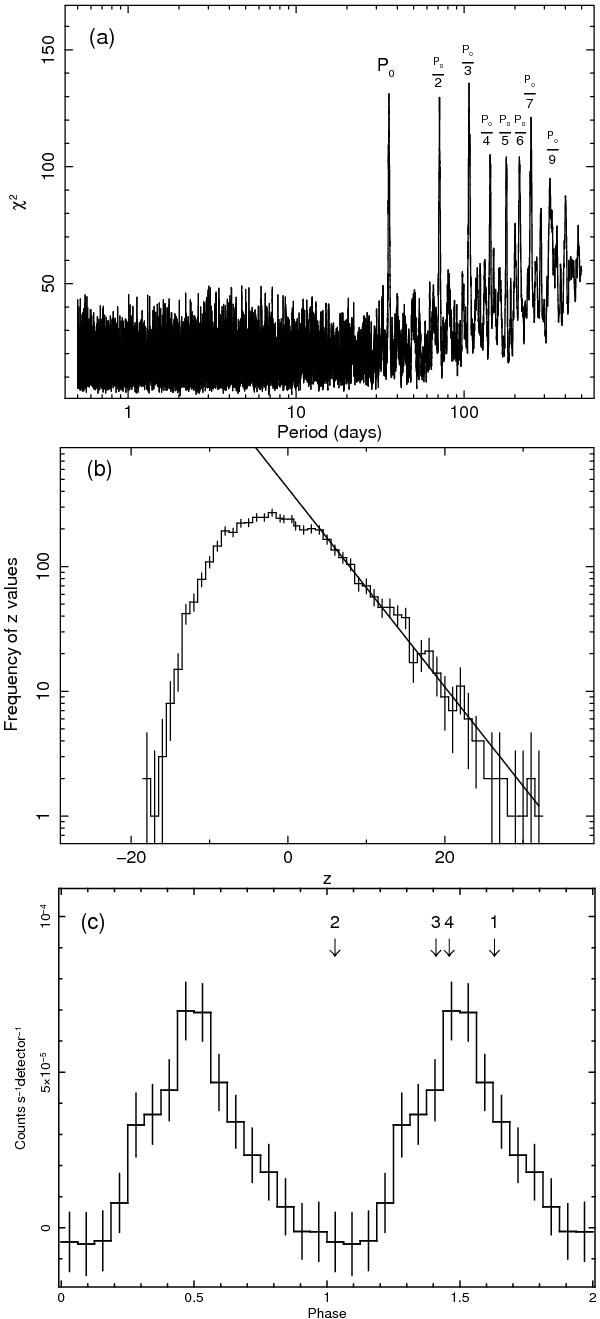
a) Periodogram of Swift-BAT (15−45 keV) data for IGR J015712−7259. b) Histogram of the z (χ2 − Fχ2) distribution. The continuous line represents the best fit exponential model for z > 20. c) Swift-BAT light curve folded at a period Po = 35.6 d, with 16 phase bins. Two orbital cycles are shown for clarity. The phase relevant to the epoch of each XRT observation is shown with a vertical arrow.
Current usage metrics show cumulative count of Article Views (full-text article views including HTML views, PDF and ePub downloads, according to the available data) and Abstracts Views on Vision4Press platform.
Data correspond to usage on the plateform after 2015. The current usage metrics is available 48-96 hours after online publication and is updated daily on week days.
Initial download of the metrics may take a while.