Free Access
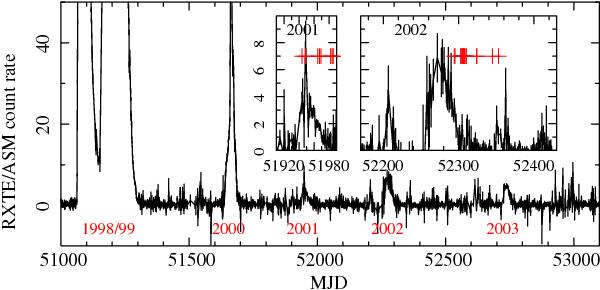
Fig. 1

The one-day averaged RXTE/ASM light curve for the period in question (count rate axes cut off at 50 counts/second for clarity but peaked at ≈490 counts/second during 1998 outburst). The epochs of our observations are marked with crosses on the zoomed inlays for the failed outbursts of 2001 and 2002.
Current usage metrics show cumulative count of Article Views (full-text article views including HTML views, PDF and ePub downloads, according to the available data) and Abstracts Views on Vision4Press platform.
Data correspond to usage on the plateform after 2015. The current usage metrics is available 48-96 hours after online publication and is updated daily on week days.
Initial download of the metrics may take a while.


