Fig. 7
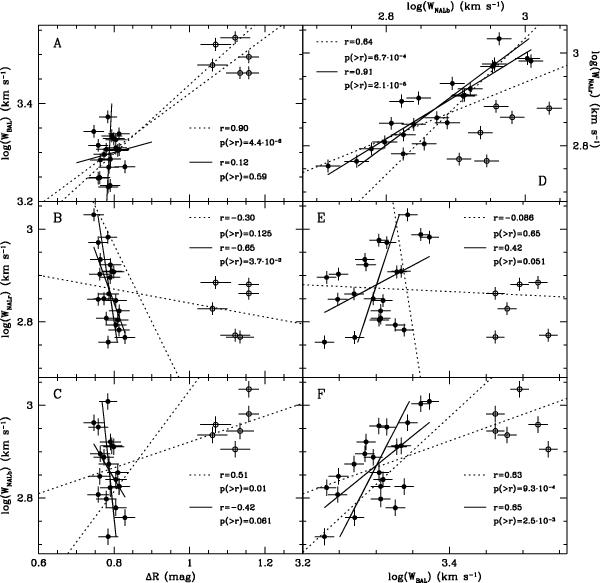
Six scatter plots for the four quantities WBAL, WNALr, WNALb, and ΔR: (A)WBAL vs. ΔR; (B)WNALr vs. ΔR; (C)WNALb vs. ΔR; D)WNALr vs. WNALb; (E)WNALr vs. WBAL; (F)WNALb vs. WBAL. Filled circles represent data for MJD < 55 000, open circles for MJD > 55 000 (the last 6 epochs). Pairs of regression lines represent linear fits of one variable versus the other and vice versa. Dotted lines refer to the whole set of data, while continuous lines only refer to filled circles. Correlation coefficients and the relevant probabilities are indicated in each panel.
Current usage metrics show cumulative count of Article Views (full-text article views including HTML views, PDF and ePub downloads, according to the available data) and Abstracts Views on Vision4Press platform.
Data correspond to usage on the plateform after 2015. The current usage metrics is available 48-96 hours after online publication and is updated daily on week days.
Initial download of the metrics may take a while.