Fig. 4
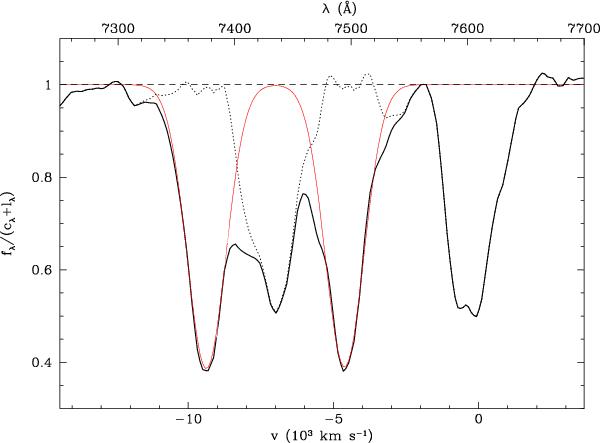
Decomposition of the C IV absorption structure at a particular epoch (MJD 52 695.4). The flux is divided by the pseudo-continuum computed with ξc = ξl = 1. Two Gaussian profiles (red) represent the main component BAL1 and BAL2 of the BAL. The dotted line is the residual absorption corresponding to the blue NAL. The velocity scale is based on the systemic redshift z = 3.911.
Current usage metrics show cumulative count of Article Views (full-text article views including HTML views, PDF and ePub downloads, according to the available data) and Abstracts Views on Vision4Press platform.
Data correspond to usage on the plateform after 2015. The current usage metrics is available 48-96 hours after online publication and is updated daily on week days.
Initial download of the metrics may take a while.