Fig. 3
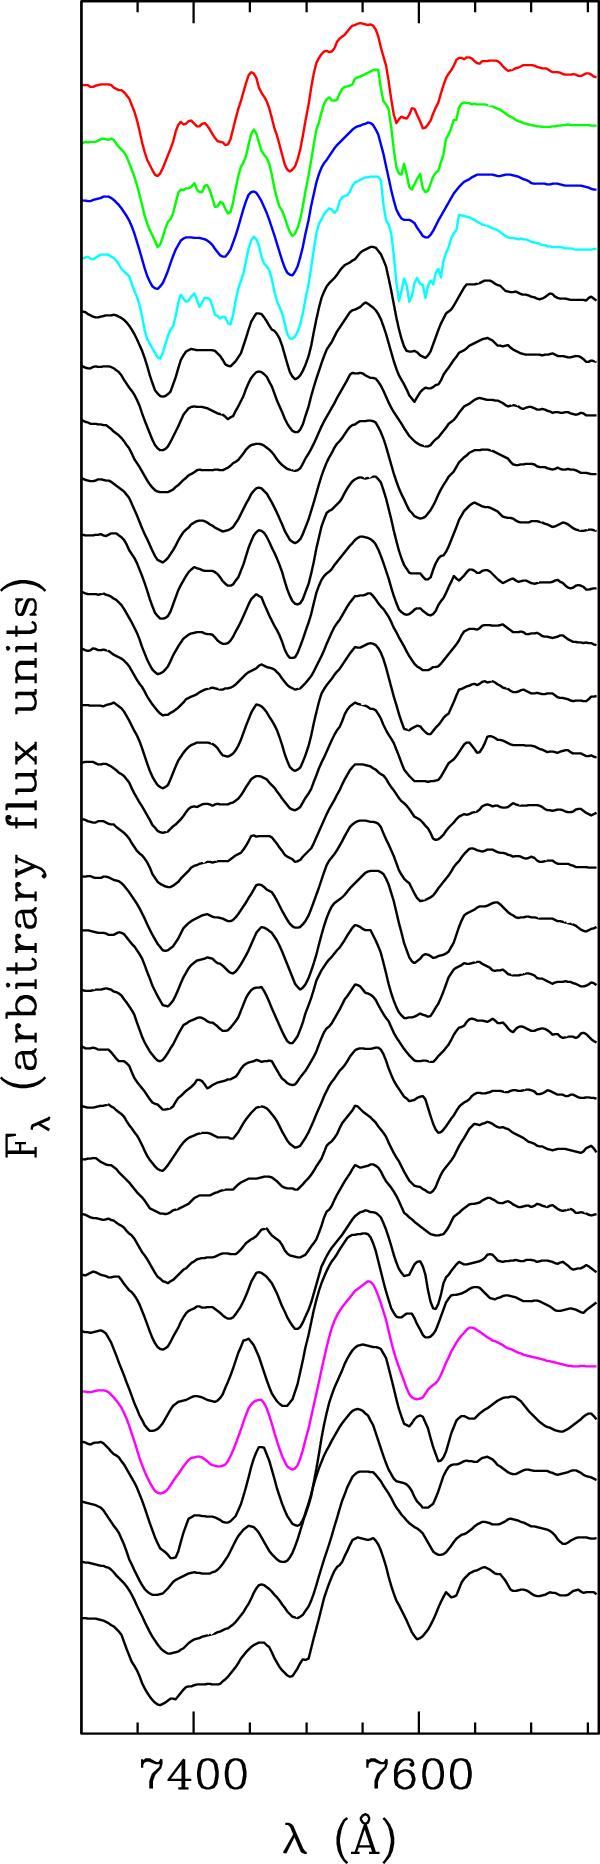
Evolution in time of the spectral region around C IV emission line. From top to bottom, the first (red) and third (blue) spectra correspond to INT and Steward Observatory data, the second (green), the fourth (cyan), and 24th (magenta) epochs correspond respectively to Keck, HST, and TNG spectra, smoothed to match the resolution of the Asiago spectra (see Table 1). All spectra are shown with the same flux scale and an arbitrary shift between each other. At a glance it is clear that the BAL feature retains its global shape with time.
Current usage metrics show cumulative count of Article Views (full-text article views including HTML views, PDF and ePub downloads, according to the available data) and Abstracts Views on Vision4Press platform.
Data correspond to usage on the plateform after 2015. The current usage metrics is available 48-96 hours after online publication and is updated daily on week days.
Initial download of the metrics may take a while.