Fig. 2
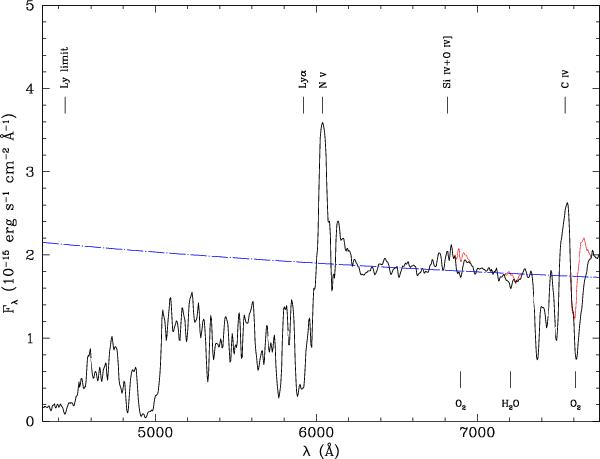
Spectrum of APM 08279+5255 obtained with the AFOSC camera at the 1.82 m Copernicus Telescope of the Asiago Observatory. The identification of the main absorption and emission features are indicated. The red line represents the correction for the telluric O2 and H2O bands. A power-law fit through spectral regions relatively free of absorption or emission features is also shown (see Sect. 4.1).
Current usage metrics show cumulative count of Article Views (full-text article views including HTML views, PDF and ePub downloads, according to the available data) and Abstracts Views on Vision4Press platform.
Data correspond to usage on the plateform after 2015. The current usage metrics is available 48-96 hours after online publication and is updated daily on week days.
Initial download of the metrics may take a while.