Fig. 1
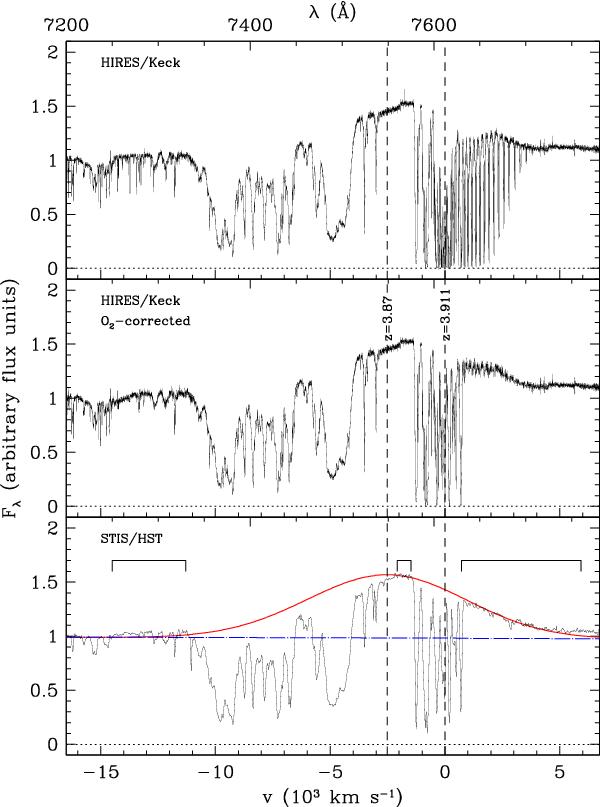
The (uncalibrated) flux in the λλ7200−7780 Å region. Top panel: from the Keck HIRES high-resolution spectrum (Ellison et al. 1999); middle panel: the same spectrum after correction for telluric O2 band (see Sect. 3); bottom panel: from HST STIS spectrum (Lewis et al. 2002), where the continuum (blue dashed line) and a Gaussian fit to the C IV emission line (red curve) are shown. A comparison of middle and bottom panels shows that the O2 correction is satisfactory. The velocity scale is based on the systemic redshift z = 3.911 (Downes et al. 1999).
Current usage metrics show cumulative count of Article Views (full-text article views including HTML views, PDF and ePub downloads, according to the available data) and Abstracts Views on Vision4Press platform.
Data correspond to usage on the plateform after 2015. The current usage metrics is available 48-96 hours after online publication and is updated daily on week days.
Initial download of the metrics may take a while.