Fig. 6
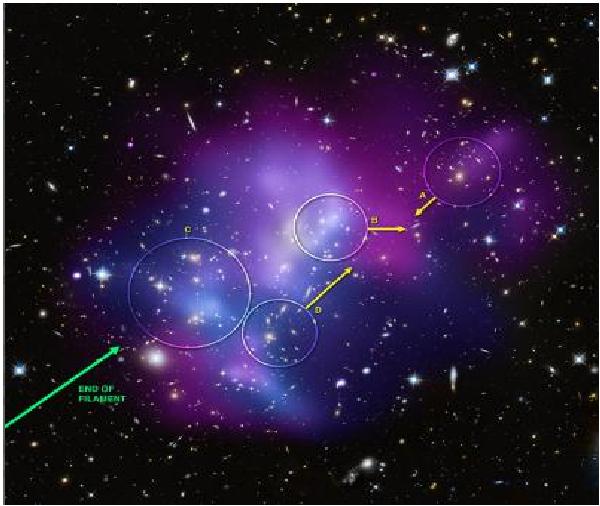
MACS J0717.5 + 3745: Chandra color image on HST showing galaxies in 4 different clusters involved in collision, with direction of motion for the three fastest moving clusters. The length of the arrow shows the approximate speed in a direction perpendicular to the line of sight. The direction of motion of the cluster appears roughly parallel to the direction of the filament (Credit: X-ray, NASA/CXC/IfA/C. Ma et al. 2008, 2009; Optical, NASA/STScI/IfA/C. Ma et al. 2008, 2009). The color represents the temperature scale of the cluster, where the blue color indicates the hottest region and reddish purple color indicates the cooler region and the temperatures in between are represented by purple.
Current usage metrics show cumulative count of Article Views (full-text article views including HTML views, PDF and ePub downloads, according to the available data) and Abstracts Views on Vision4Press platform.
Data correspond to usage on the plateform after 2015. The current usage metrics is available 48-96 hours after online publication and is updated daily on week days.
Initial download of the metrics may take a while.