Fig. 3
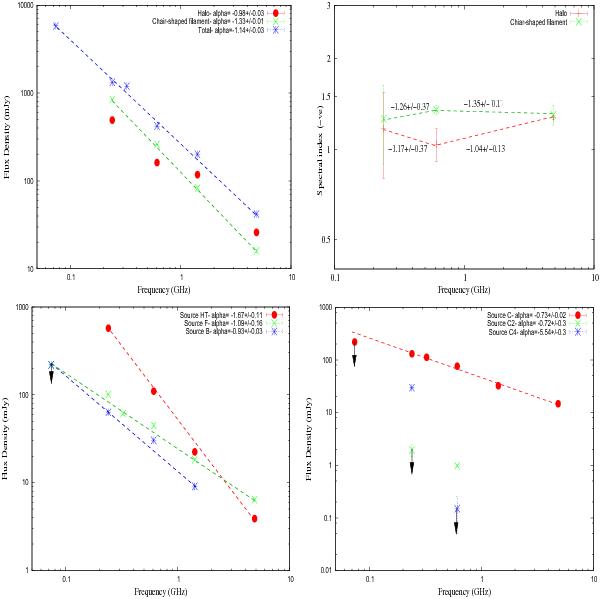
Top left panel: integrated radio spectra of the halo, “Chair-shaped” filament source and total (halo+“Chair-shaped” filament source). Top right panel: spectral index variation with respect to frequency for the halo and “Chair-shaped” filament source. Bottom left panel: integrated radio spectra of extended sources HT, B and F. Bottom right panel: integrated radio spectra of compact source C, C2 and C4. The down arrows represent the 3σ detection limit. Data from literature (Bonafede et al. 2009b; survey data) are plotted at 4.86, 1.4, 0.325 and 0.074 GHz along with 0.61 and 0.235 GHz GMRT data.
Current usage metrics show cumulative count of Article Views (full-text article views including HTML views, PDF and ePub downloads, according to the available data) and Abstracts Views on Vision4Press platform.
Data correspond to usage on the plateform after 2015. The current usage metrics is available 48-96 hours after online publication and is updated daily on week days.
Initial download of the metrics may take a while.