Fig. 6
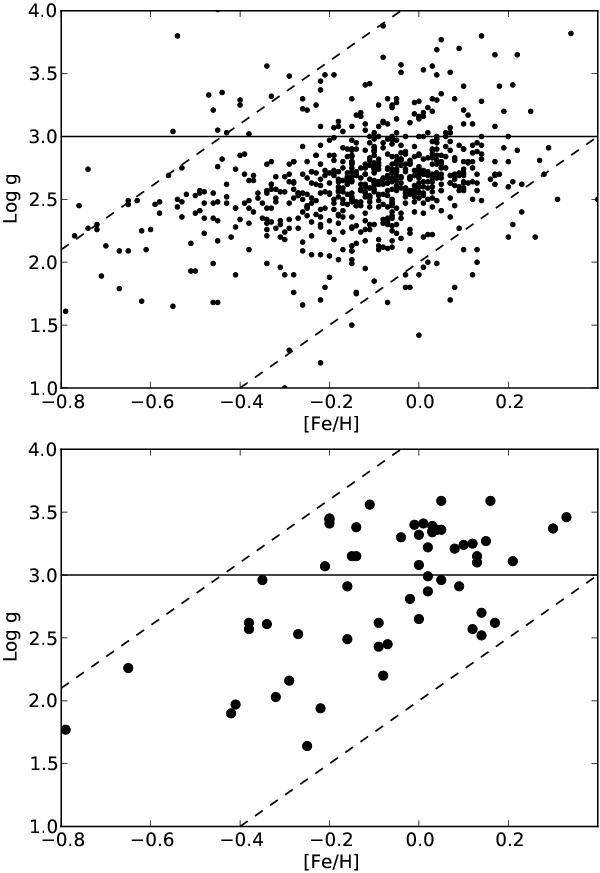
Surface gravity log g versus metallicity for the giant comparison sample used in this work (upper panel) and for our evolved planet hosts (lower panel). The values were calculated with the TS13 line list. The horizontal line denotes the limit in surface gravity for the subsample of red giants. The two dashed lines were drawn by eye and show the biases in the samples due to the B − V cut-off.
Current usage metrics show cumulative count of Article Views (full-text article views including HTML views, PDF and ePub downloads, according to the available data) and Abstracts Views on Vision4Press platform.
Data correspond to usage on the plateform after 2015. The current usage metrics is available 48-96 hours after online publication and is updated daily on week days.
Initial download of the metrics may take a while.