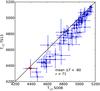
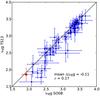
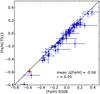
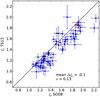
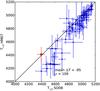
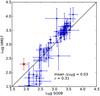
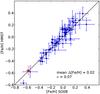
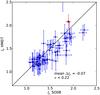
Fig. A.1
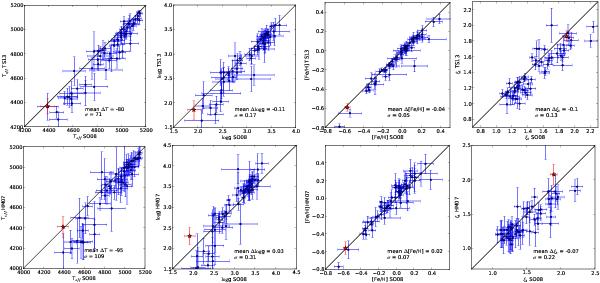
Comparisons of the spectroscopic results from the different line lists for effective temperature, surface gravity, metallicity, and microturbulence. In the left panels, the results from the TS13 line list are plotted versus the results from SO08. The middle panels are HM07 versus SO08 and the right panels HM07 versus TS13. The measurements for the reference star Arcturus are overplotted with a star symbol. The dashed line in the top-right panel represents a second degree polynomial fit.
Current usage metrics show cumulative count of Article Views (full-text article views including HTML views, PDF and ePub downloads, according to the available data) and Abstracts Views on Vision4Press platform.
Data correspond to usage on the plateform after 2015. The current usage metrics is available 48-96 hours after online publication and is updated daily on week days.
Initial download of the metrics may take a while.