Fig. 5
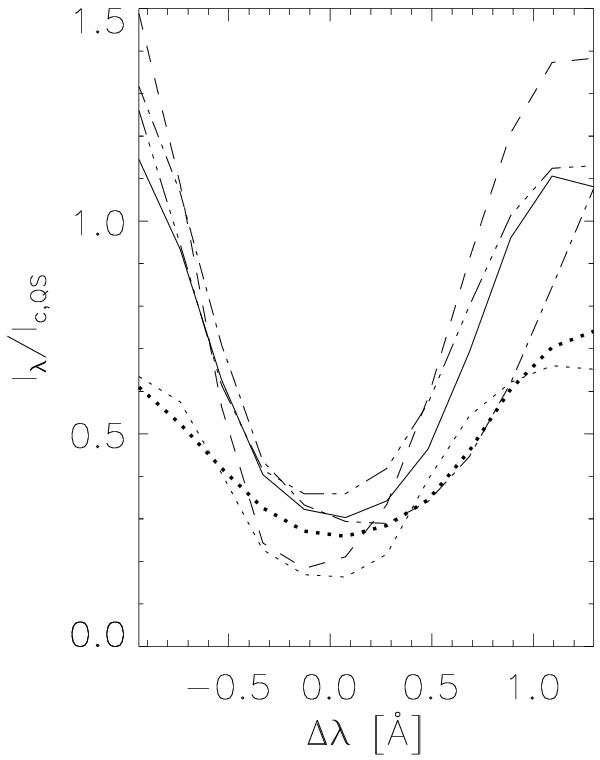
Examples of observed Hα profiles from Ellerman bombs (EBs) normalised to continuum intensity of quiet Sun profile; thin dotted: average profile of the flat fields from disc centre, normalised with profile from the FTS Atlas (Brault and Neckel, quoted by Neckel 1999); thick dotted: average profile of AR near EB 2 outside sunspots and pores.
Current usage metrics show cumulative count of Article Views (full-text article views including HTML views, PDF and ePub downloads, according to the available data) and Abstracts Views on Vision4Press platform.
Data correspond to usage on the plateform after 2015. The current usage metrics is available 48-96 hours after online publication and is updated daily on week days.
Initial download of the metrics may take a while.