Fig. 2
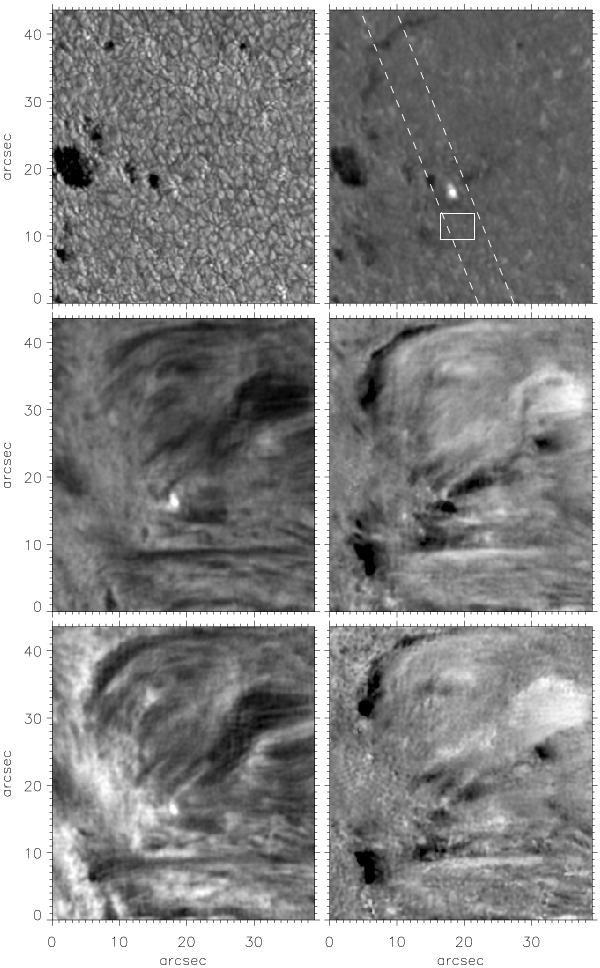
Upper row: as Fig. 1 for EB 2; middle row left: intensity at −0.45 Å off line centre of average profile; middle row right: velocity measured from bisectors at wing positions where EB contrast is brightest (see text); lower row left: line minimum intensity; lower row right: velocity from line minimum position, limb direction and terrestrial north same as in Fig. 1.
Current usage metrics show cumulative count of Article Views (full-text article views including HTML views, PDF and ePub downloads, according to the available data) and Abstracts Views on Vision4Press platform.
Data correspond to usage on the plateform after 2015. The current usage metrics is available 48-96 hours after online publication and is updated daily on week days.
Initial download of the metrics may take a while.