Fig. 16
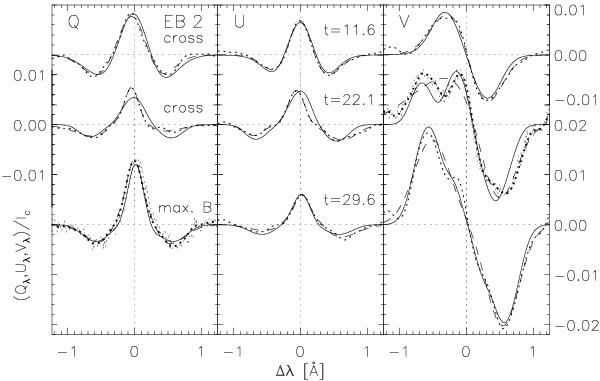
Temporal evolution of (Q,U,V) profiles from EB 2; positions: crosses in 5th and 12th columns in Fig. 11 at t = 11.6 min and 22.1 min, respectively, and maximum of B in 2nd last column of same figure for t = 29.6 min; thin and thick dotted V profiles at t = 22.1 min. Q profiles at t = 29.6 min are unfiltered and filtered profiles, respectively.
Current usage metrics show cumulative count of Article Views (full-text article views including HTML views, PDF and ePub downloads, according to the available data) and Abstracts Views on Vision4Press platform.
Data correspond to usage on the plateform after 2015. The current usage metrics is available 48-96 hours after online publication and is updated daily on week days.
Initial download of the metrics may take a while.