Fig. 11
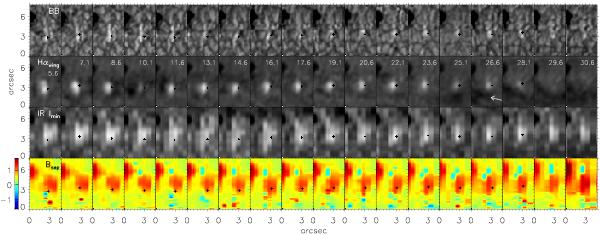
Temporal evolution of EB 2 after interruption of its observation (see Fig. 10). Maps with cadence of 90 s from left to right. Top row: broadband (BB); second row: Hαwing with times (in min) since start of observation of this EB; third row: minimum intensity of IR line; fourth row: Bsep from separation of Stokes V amplitudes including sign; black crosses as in Figs. 6 to 8. Numbers at the colour bar are field strength in kG. Arrow in last fourth Hαwing image indicates absorbing, dark clouds crossing from W to E in lower part of map.
Current usage metrics show cumulative count of Article Views (full-text article views including HTML views, PDF and ePub downloads, according to the available data) and Abstracts Views on Vision4Press platform.
Data correspond to usage on the plateform after 2015. The current usage metrics is available 48-96 hours after online publication and is updated daily on week days.
Initial download of the metrics may take a while.