Fig. 10
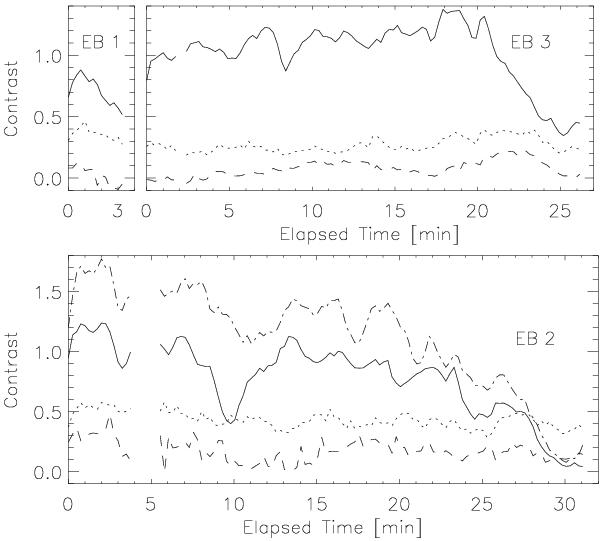
Temporal evolution of contrasts C of the three EBs under study;
solid: maximum C of EBs from Hαwing,
dash-dotted for EB 2: maximum C from blue wing alone; dashed:
C of broadband image (at 6300 Å) at position of maximum of
Hα EB, shifted by 0 5; dotted:
maximum C of broadband in the facula associated with the EB.
Elapsed time is time since start of observation of the particular target.
5; dotted:
maximum C of broadband in the facula associated with the EB.
Elapsed time is time since start of observation of the particular target.
Current usage metrics show cumulative count of Article Views (full-text article views including HTML views, PDF and ePub downloads, according to the available data) and Abstracts Views on Vision4Press platform.
Data correspond to usage on the plateform after 2015. The current usage metrics is available 48-96 hours after online publication and is updated daily on week days.
Initial download of the metrics may take a while.