Fig. 3
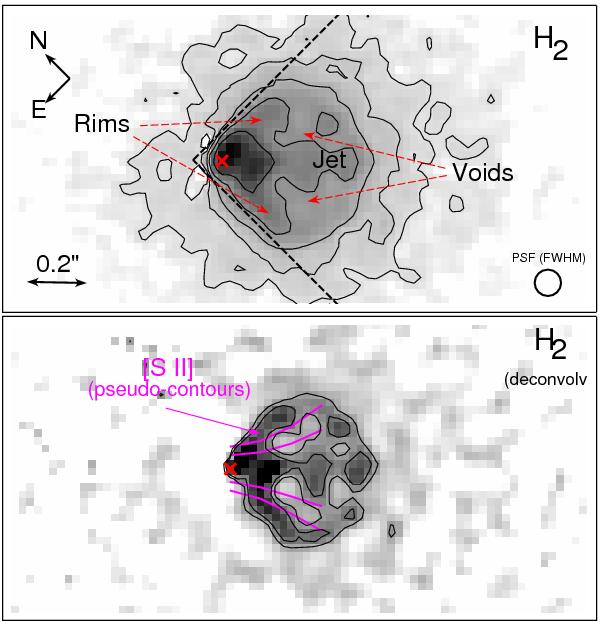
Top: Inner part of the H2 emission. Contours start at 10 counts per pixel increasing by a factor of two. The dashed lines indicate the cone used to extract the radial dependence of the count rate. Bottom: Deconvolved H2 image. The magenta lines indicate the region containing 68% and 90% (outer lines) of the [S ii] emission in the velocity range +25 to –120 km s-1 perpendicular to the jet axis.
Current usage metrics show cumulative count of Article Views (full-text article views including HTML views, PDF and ePub downloads, according to the available data) and Abstracts Views on Vision4Press platform.
Data correspond to usage on the plateform after 2015. The current usage metrics is available 48-96 hours after online publication and is updated daily on week days.
Initial download of the metrics may take a while.