Fig. 2
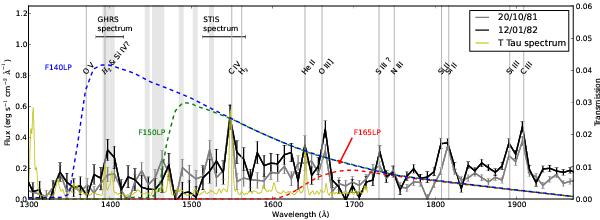
Re-binned IUE FUV spectra of DG Tau with filter transmission curves of the ACS images superimposed (right axis). Strong lines are labeled and the band-passes of the high-resolution spectra are indicated. The filter efficiencies are indicated by the dashed lines (right axis). For comparison, the higher resolution HST STIS spectrum of T Tau is also shown (yellow). The gray-shaded regions indicate strong H2 lines.
Current usage metrics show cumulative count of Article Views (full-text article views including HTML views, PDF and ePub downloads, according to the available data) and Abstracts Views on Vision4Press platform.
Data correspond to usage on the plateform after 2015. The current usage metrics is available 48-96 hours after online publication and is updated daily on week days.
Initial download of the metrics may take a while.