Fig. 1
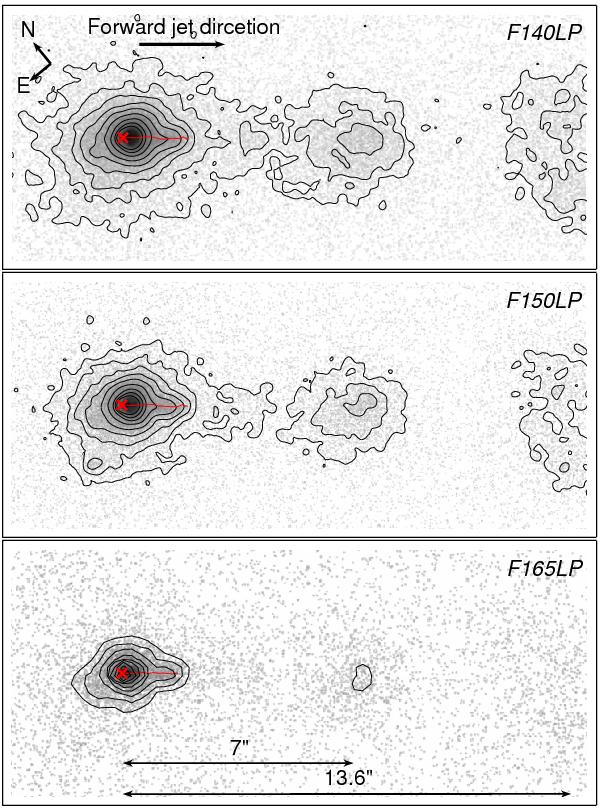
FUV images of the DG Tau jet. From top to bottom: F140LP, F150LP, F165LP. The ranges of the logarithmic scaling differ between panels. Contour levels are equal in all frames, they start at 2 counts/pix (smoothed by a Gaussian of 0 25) and increase in steps of a factor of two. The cross indicates the position of DG Tau (the size of the cross gives the uncertainty).The outermost emission knot is at the edge of the detector, and its bow/apex is outside the field of view. The red line indicates the jet center.
Current usage metrics show cumulative count of Article Views (full-text article views including HTML views, PDF and ePub downloads, according to the available data) and Abstracts Views on Vision4Press platform.
Data correspond to usage on the plateform after 2015. The current usage metrics is available 48-96 hours after online publication and is updated daily on week days.
Initial download of the metrics may take a while.