Fig. 4
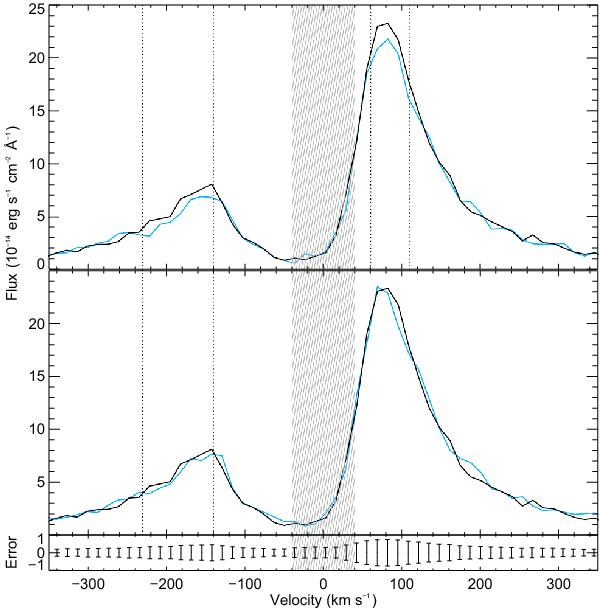
Lyman-α line of HD 189733b as a function of velocity, in September 2011 (Lecavelier des Etangs et al. 2012; Bourrier et al. 2013). The spectrum measured before the planet transit is displayed as a black line, to be compared with the spectra observed during (blue line, top panel) and after (blue line, bottom panel) the transit. The striped gray zone corresponds to the region contaminated by the geocoronal emission. The absorption signatures detected in the blue wing of the line during the transit and the post-transit and in the red wing during the transit are delimited by vertical dotted lines. The bottom panel shows the error bars on the flux measured before the transit.
Current usage metrics show cumulative count of Article Views (full-text article views including HTML views, PDF and ePub downloads, according to the available data) and Abstracts Views on Vision4Press platform.
Data correspond to usage on the plateform after 2015. The current usage metrics is available 48-96 hours after online publication and is updated daily on week days.
Initial download of the metrics may take a while.