Fig. 26
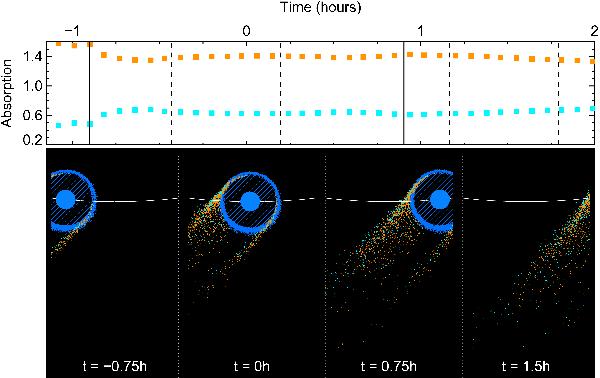
Same plot as in Fig. 25. Top panel: absorption over the range −230 to −175 km s-1 (orange symbols) and −175 to −140 km s-1 (blue symbols) for a simulation of atmospheric escape from HD 189733b (escape rate Ṁ = 2 × 10⁹ g s-1; ionizing flux Fion = 3 F⊙; stellar wind with velocity Vwind = 200 km s-1, temperature Twind = 3 × 10⁴ K and density nwind = 2 × 104 cm-3). Vertical dashed lines show the beginning and end of STIS transit and post-transit observations. An absorption signature was detected by Lecavelier des Etangs et al. (2012) in the blue wing of the Lyman-α line between −230 and −140 km s-1. Bottom panel: views of the gas in the orbital plane that moves in the velocity intervals described above (orange and light blue), and between −140 km s-1 and 40 km s-1 (deep blue). The cometary tail is mostly composed of high-velocity atoms accelerated by interactions with the stellar wind. These atoms keep their Maxwellian velocity distribution as they move farther away from the planet. As a result, the relative absorption over any velocity interval is roughly constant with time. The relative level of the absorption depends on the proportion of atoms in the Maxwellian distribution for a given velocity interval.
Current usage metrics show cumulative count of Article Views (full-text article views including HTML views, PDF and ePub downloads, according to the available data) and Abstracts Views on Vision4Press platform.
Data correspond to usage on the plateform after 2015. The current usage metrics is available 48-96 hours after online publication and is updated daily on week days.
Initial download of the metrics may take a while.