Fig. 23
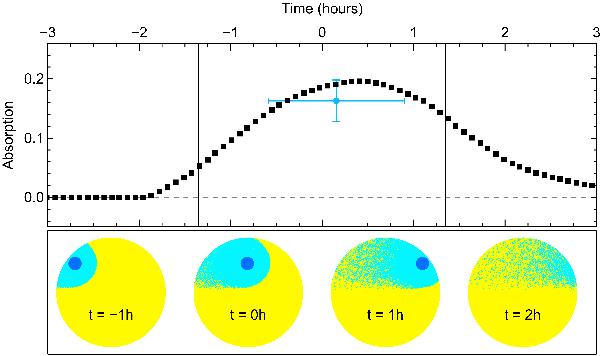
Top panel: total absorption over the range −130 to −40 km s-1, for a simulation of atmospheric escape from HD 209458b (escape rate Ṁ = 109 g s-1; ionizing flux Fion = 3 F⊙). Vertical solid lines show the beginning and end of ingress and egress of the transit. The blue point shows the observed absorption, with the horizontal error bar displaying the duration of the observation. Each square corresponds to a time step in the simulation. The variations of the absorption depth are correlated to the optical depth of the hydrogen cloud and the stellar surface it occults. Bottom panel: views of the gas (light blue) and planet (deep blue) transit along the star/Earth line of sight. Only particles with observed velocities in the range −130 to −40 km s-1 are represented.
Current usage metrics show cumulative count of Article Views (full-text article views including HTML views, PDF and ePub downloads, according to the available data) and Abstracts Views on Vision4Press platform.
Data correspond to usage on the plateform after 2015. The current usage metrics is available 48-96 hours after online publication and is updated daily on week days.
Initial download of the metrics may take a while.