Fig. 22
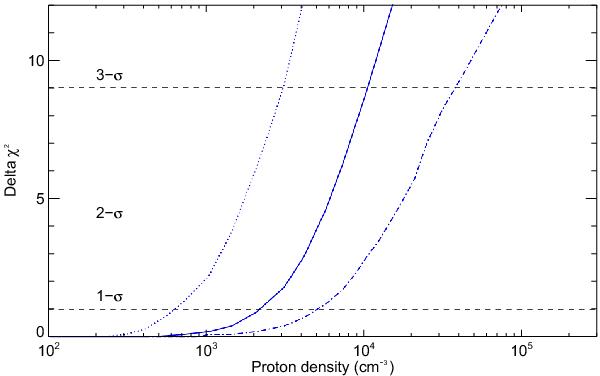
χ2 difference between simulations of the 2010 data and the best fit without atmospheric escape as a function of the stellar wind density, assuming a constant escape rate and ionizing flux (Ṁ = 2 × 10⁹ g s-1 and Fion = 10 F⊙, thick blue line). The intersection with the black dotted lines gives the proton density above which an absorption signature would have been detected at more than 1, 2 or 3σ in the 2010 observations. The upper limit on the proton density decreases with higher escape rates (Ṁ = 2 × 10¹⁰ g s-1 and Fion = 10 F⊙, blue dotted line) and increases with higher ionizing fluxes (Ṁ = 2 × 10⁹ g s-1 and Fion = 20 F⊙, blue dash-dotted line).
Current usage metrics show cumulative count of Article Views (full-text article views including HTML views, PDF and ePub downloads, according to the available data) and Abstracts Views on Vision4Press platform.
Data correspond to usage on the plateform after 2015. The current usage metrics is available 48-96 hours after online publication and is updated daily on week days.
Initial download of the metrics may take a while.