Fig. 21
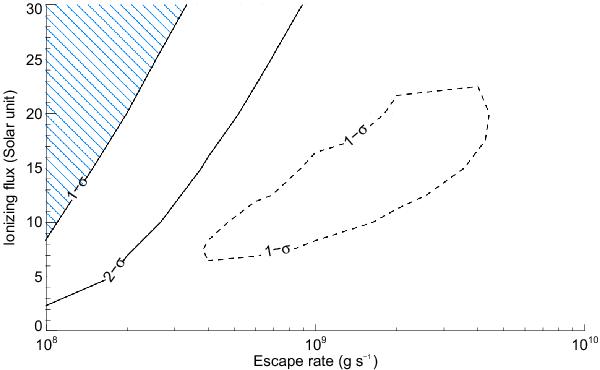
Detection levels of Lyman-α absorption in the 2010 data of HD 189733b as a function of the hydrogen escape rate and the ionizing flux (thick black lines), assuming that the stellar wind is in the “escape-limited” saturation regime. Beyond the striped blue zone, absorption would have been detected at more than 1σ. For comparison, the dashed black line shows the error bars on the best fit to the absorption signature observed in 2011 (see Fig. 20).
Current usage metrics show cumulative count of Article Views (full-text article views including HTML views, PDF and ePub downloads, according to the available data) and Abstracts Views on Vision4Press platform.
Data correspond to usage on the plateform after 2015. The current usage metrics is available 48-96 hours after online publication and is updated daily on week days.
Initial download of the metrics may take a while.