Fig. 17
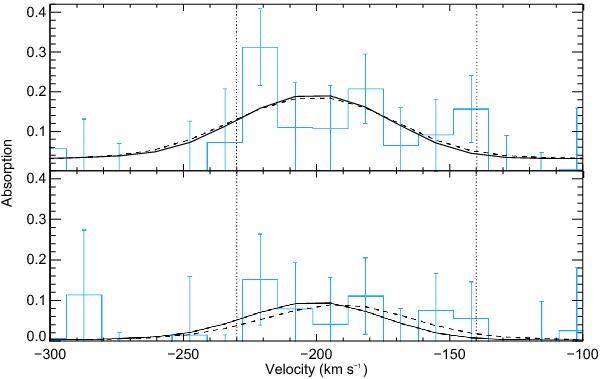
Absorption profiles during the transit (top panel) and the post-transit (bottom panel) of HD 189733b. The absorption signature observed in 2011 at high velocities in the blue wing of the Lyman-α line is delimited by vertical black dotted lines (blue histogram; Lecavelier des Etangs et al. 2012 and Bourrier et al. 2013). Two absorption profiles are calculated for best-fit parameters (ionizing flux Fion = 10 F⊙) in the saturation regime (solid line: escape rate Ṁ = 109 g s-1 and proton density nwind = 106 cm-3) and out of this regime (dashed line: escape rate Ṁ = 8 × 10¹⁰ g s-1 and proton density nwind = 2 × 103 cm-3). The main difference between the two profiles is the absorption at the center of the line, which is significantly reduced in the saturation regime, although for HD 189733b the Lyman-α flux at these wavelengths is in any case completely absorbed by the blueshifted ISM (see Fig. 1). The simulated planetary disk causes an absorption depth of ~2.3% at all wavelengths during the transit.
Current usage metrics show cumulative count of Article Views (full-text article views including HTML views, PDF and ePub downloads, according to the available data) and Abstracts Views on Vision4Press platform.
Data correspond to usage on the plateform after 2015. The current usage metrics is available 48-96 hours after online publication and is updated daily on week days.
Initial download of the metrics may take a while.