Fig. 11
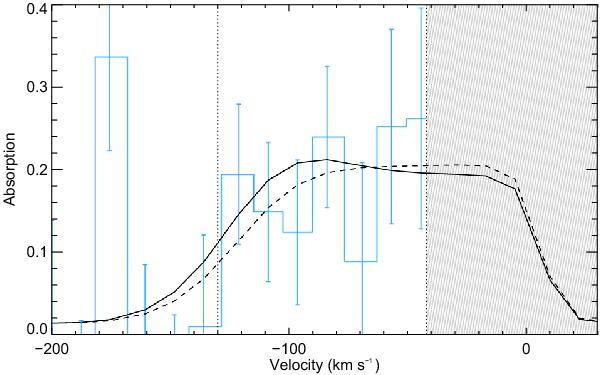
Absorption profiles during the transit of HD 209458b. The absorption signature observed in 2001 in the blue wing of the Lyman-α line is delimited by vertical black dotted lines (blue histogram; Vidal-Madjar et al. 2008), and the striped gray zone corresponds to the region contaminated by the geocoronal emission. Two absorption profiles are calculated for best-fit parameters (solid line: escape rate Ṁ = 109 g s-1 and ionizing flux Fion = 3 F⊙; dashed line: escape rate Ṁ = 1010 g s-1 and ionizing flux Fion = 4 F⊙). The simulated planetary disk is the source for an absorption depth of ~1.5% at all wavelengths. A low escape rate results in a slightly decreased absorption depth at low velocity (solid line), while a high ionizing flux limits the number of atoms accelerated to high velocities (dashed line).
Current usage metrics show cumulative count of Article Views (full-text article views including HTML views, PDF and ePub downloads, according to the available data) and Abstracts Views on Vision4Press platform.
Data correspond to usage on the plateform after 2015. The current usage metrics is available 48-96 hours after online publication and is updated daily on week days.
Initial download of the metrics may take a while.