Fig. 8
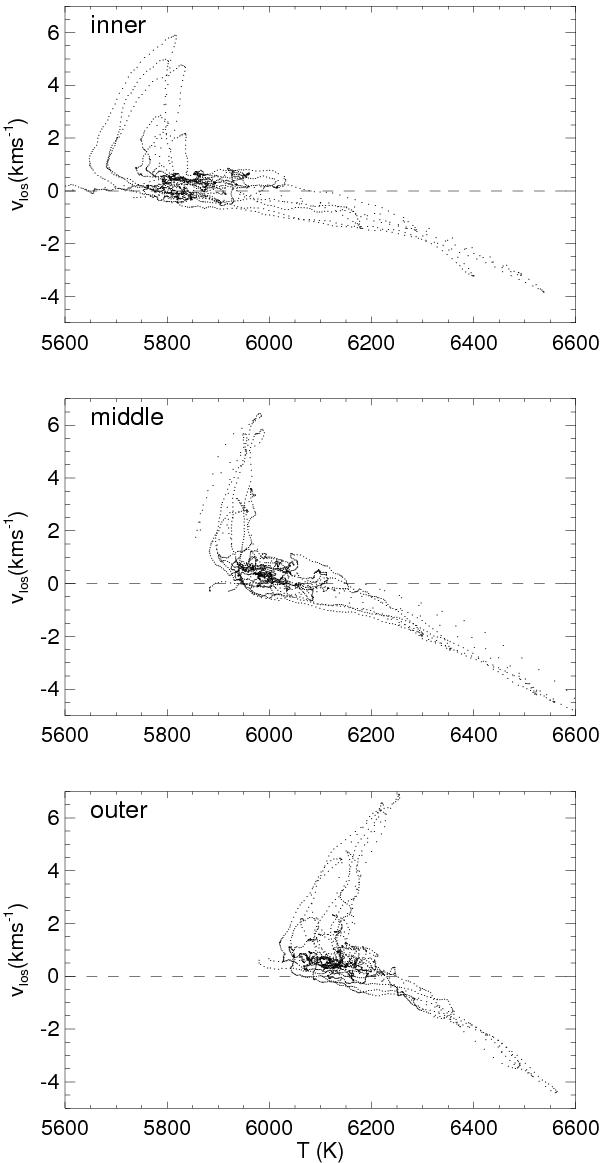
From top to bottom: scatter plot between the temperature and line-of-sight velocity of the three averaged filaments belonging to the inner, middle, and outer penumbra, respectively. Note that the surrounding pixels (more than 0.4′′ away from the filament’s central axis) are not taken into account. The alignments of the points along curves are the result of the spline interpolation along individual filaments when producing the averaged filament. This process can distribute similar values onto several pixels. The horizontal dashed line in all the three panels marks the zero velocity level.
Current usage metrics show cumulative count of Article Views (full-text article views including HTML views, PDF and ePub downloads, according to the available data) and Abstracts Views on Vision4Press platform.
Data correspond to usage on the plateform after 2015. The current usage metrics is available 48-96 hours after online publication and is updated daily on week days.
Initial download of the metrics may take a while.