Fig. 5
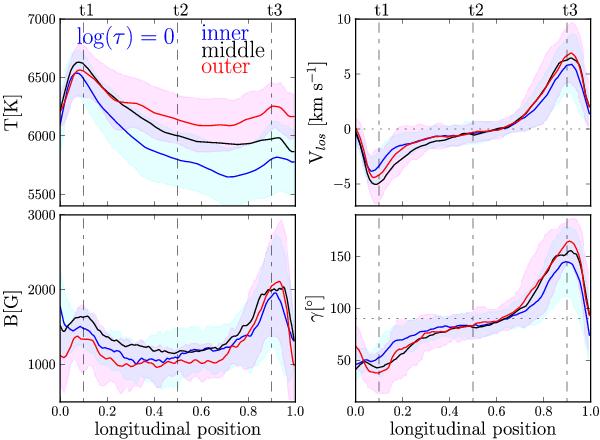
Variations of the physical parameters T, vlos, B, and γ at log (τ) = 0 along the longitudinal cut denoted by horizontal dashed lines in Fig. 4. Parameters of averaged filaments in the inner, middle, and outer parts of the penumbra are plotted together in each panel. vlos = 0 and γ = 90° are indicated by horizontal dotted lines. Locations of the cuts t1-t3 are marked as vertical dot-dashed lines. The standard deviations of the parameters among the 20 filaments entering the averaged inner and outer curve are indicated by the semi-transparent shaded areas, with each having the same color as the line it is associated with. The violet shading indicates overlap between properties of the filaments in the inner and the outer penumbra. The standard deviation of the averaged middle filament is not shown to keep the picture clearer.
Current usage metrics show cumulative count of Article Views (full-text article views including HTML views, PDF and ePub downloads, according to the available data) and Abstracts Views on Vision4Press platform.
Data correspond to usage on the plateform after 2015. The current usage metrics is available 48-96 hours after online publication and is updated daily on week days.
Initial download of the metrics may take a while.