Fig. 4
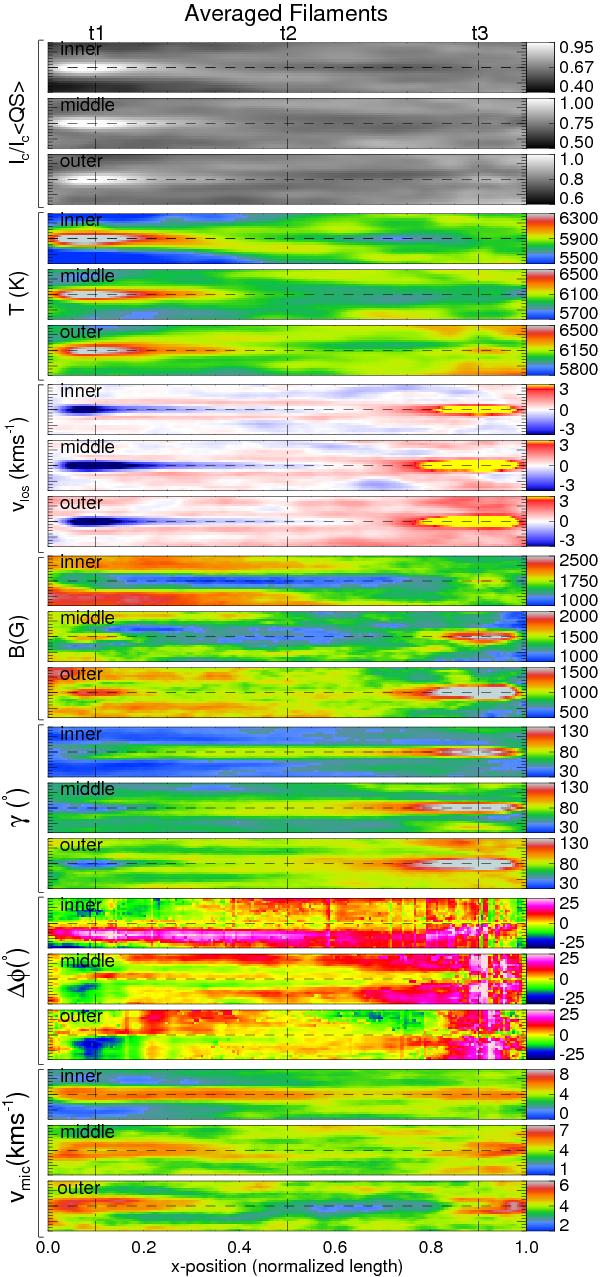
From top to bottom: three plots each of the physical quantities fitted continuum intensity Ic/Ic ⟨ QS ⟩, where ⟨ QS ⟩ implies the average over all quiet Sun pixels, temperature T, line-of-sight velocity vlos, magnetic field strength B, inclination γ, azimuth Δφ, and microturbulent velocity vmic of averaged filaments from inner, middle, and outer parts of the sunspot penumbra. X = 0 refers to the head of filament (the position closest to the umbra). The radial location in the penumbra of each panel is labeled on the upper left-hand corner of each panel. All plots are at depth log (τ) = 0. The dashed and dot-dashed lines mark a longitudinal and three transverse cuts (labeled as t1, t2, t3 above the top panel, belonging to head, center, and tail of the filaments, respectively), along which various physical parameters are plotted in Figs. 5 and 6. Note that color bars for a single parameter do not always have the same range for all three maps of a given physical parameter. The color scale of the velocity has been saturated at ± 3 km s-1 in order to highlight the smaller velocities along the bulk of the filament.
Current usage metrics show cumulative count of Article Views (full-text article views including HTML views, PDF and ePub downloads, according to the available data) and Abstracts Views on Vision4Press platform.
Data correspond to usage on the plateform after 2015. The current usage metrics is available 48-96 hours after online publication and is updated daily on week days.
Initial download of the metrics may take a while.