Fig. 2
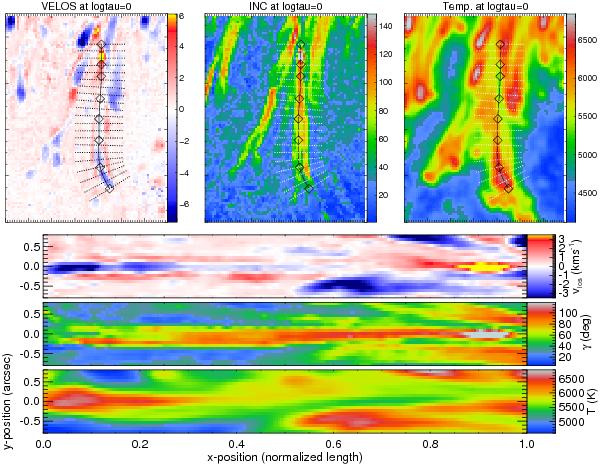
Selection of a filament. The three maps from left to right in the upper panel display line-of-sight velocity vlos (in km s-1), field inclination γ (in degrees), and temperature T (in K). The diamonds are selected points lying along the filament’s axis, between which a spline interpolation is performed. The area selected for the study of this filament is covered by the transverse lines. The vlos, γ, and T of the selected filament in its de-stretched and scaled form at log (τ) = 0 are shown in the lower panel.
Current usage metrics show cumulative count of Article Views (full-text article views including HTML views, PDF and ePub downloads, according to the available data) and Abstracts Views on Vision4Press platform.
Data correspond to usage on the plateform after 2015. The current usage metrics is available 48-96 hours after online publication and is updated daily on week days.
Initial download of the metrics may take a while.