Fig. 1
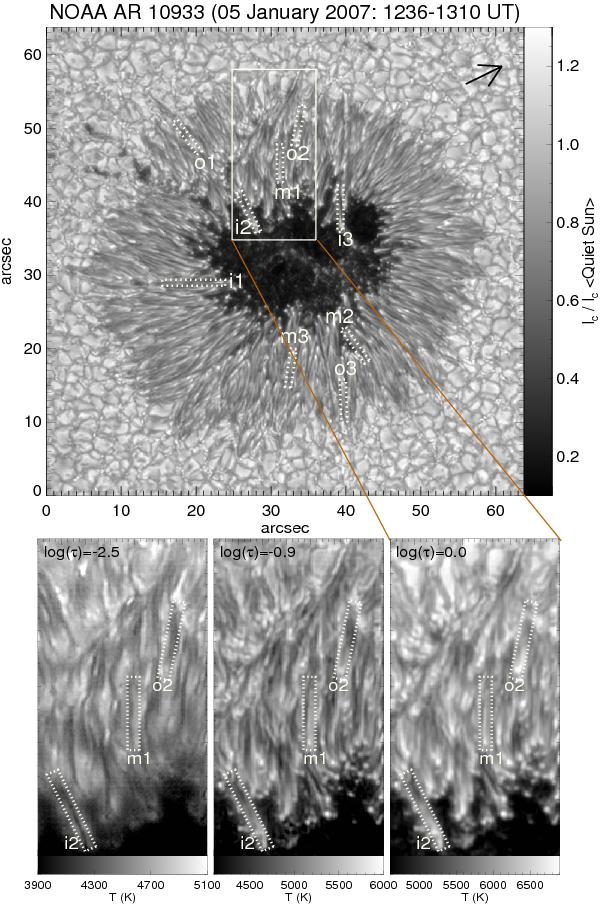
Upper panel: continuum intensity map of NOAA AR 10933. The small dotted-line boxes represent locations of nine (out of 60) penumbral filaments selected for study. Filaments are not always ideally straight and therefore do not always fit completely in such boxes (which are for illustrative purposes only). Three examples each of filaments located in the inner, middle, and outer penumbra, respectively, are named as i1, i2, i3, m1, m2, m3 and o1, o2, o3. The arrow in the upper right corner points in the direction of the solar disk center. In the lower panels, we show temperature at log (τ) = −2.5, − 0.9 and 0 for the region enclosed by the large solid-line box in the upper panel. Dark lanes within penumbral filaments are seen in the higher layers.
Current usage metrics show cumulative count of Article Views (full-text article views including HTML views, PDF and ePub downloads, according to the available data) and Abstracts Views on Vision4Press platform.
Data correspond to usage on the plateform after 2015. The current usage metrics is available 48-96 hours after online publication and is updated daily on week days.
Initial download of the metrics may take a while.