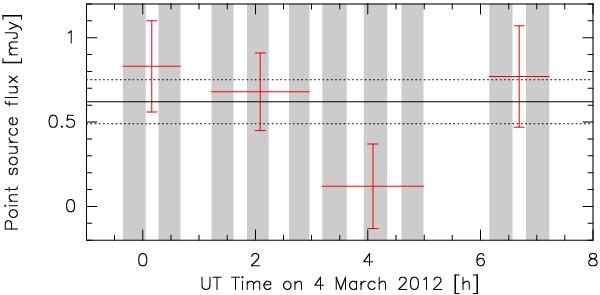
Fig. 2

Point source fluxes as measured by fitting a point source to four visibility subsets. The grey areas indicate the periods when the instrument was actually observing the comet. The horizontal red bars represent the time coverage of each of the 4 subsets. The black solid line represents the flux measured on the entire dataset, the ±1σ levels being indicated by the dotted lines.
Current usage metrics show cumulative count of Article Views (full-text article views including HTML views, PDF and ePub downloads, according to the available data) and Abstracts Views on Vision4Press platform.
Data correspond to usage on the plateform after 2015. The current usage metrics is available 48-96 hours after online publication and is updated daily on week days.
Initial download of the metrics may take a while.


