Fig. 13

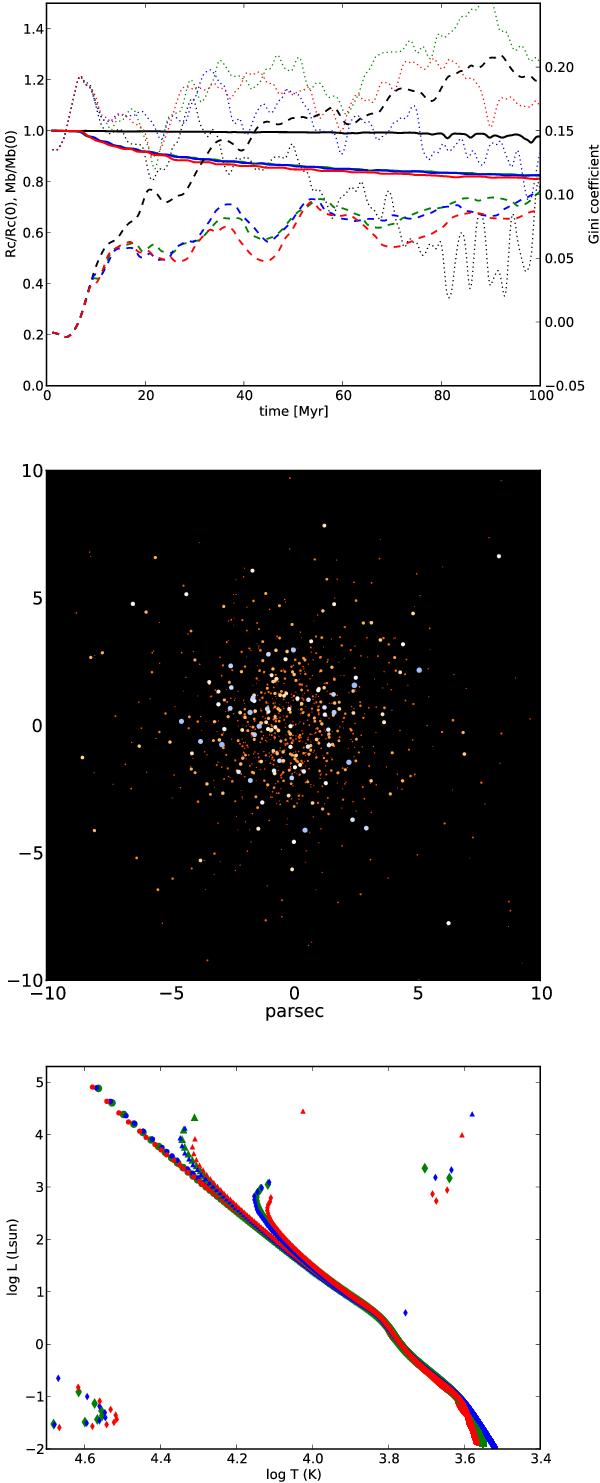
Cluster evolution with live stellar evolution. The upper panel shows the evolution of the core radius (normalized on the initial core radius, dotted lines), bound mass fraction (as fraction of the initial mass, solid lines) and the evolution of the mass segregation as quantified by the Converse & Stahler (2008) “Gini” coefficient (dashed lines) as a function of time for a N = 1000 star cluster with a salpeter IMF in the case without stellar evolution and in case the stars evolve, calculated with different stellar evolution codes. The black curves are the results for a run without stellar evolution, green are the results for SSE, blue EVtwin and red the MESA stellar evolution code. The middle panel shows the initial distribution of stars (colored according to their temperature and luminosity). The bottom panel shows the Herzsprung-Russell diagram for the stellar evolution as calculated for the different codes (colored as top panel) for the initial population (circles), after 20 Myr (triangles) and after 100 Myr (diamonds).
Current usage metrics show cumulative count of Article Views (full-text article views including HTML views, PDF and ePub downloads, according to the available data) and Abstracts Views on Vision4Press platform.
Data correspond to usage on the plateform after 2015. The current usage metrics is available 48-96 hours after online publication and is updated daily on week days.
Initial download of the metrics may take a while.


