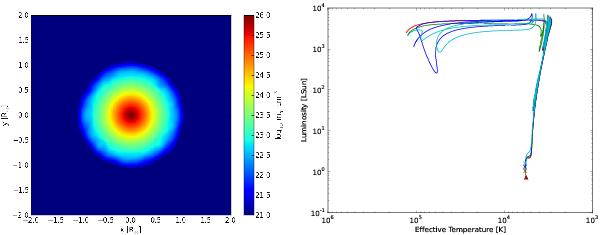
Fig. 11

Conversion of a stellar evolution model to SPH and back. Left panel shows a N = 105 SPH realization of a 1 M⊙ MESA stellar evolution model at 5 Gyr. Right panel shows the HR diagram of the evolution of a 1 M⊙ MESA model, as well as as the evolution of a MESA model derived from the SPH model, as well as two additional models which where converted at 8 and 10 Gyr of age. As can be seen the conversion at later evolutionary stages induces bigger deviations from normal evolution, probably because of the increased density contrasts (as the core becomes denser) at later times means that the particle distributions induce more mixing.
Current usage metrics show cumulative count of Article Views (full-text article views including HTML views, PDF and ePub downloads, according to the available data) and Abstracts Views on Vision4Press platform.
Data correspond to usage on the plateform after 2015. The current usage metrics is available 48-96 hours after online publication and is updated daily on week days.
Initial download of the metrics may take a while.


